HORSEFLY INSIGHTS AND TREND REPORT
Blue Bubble, Orange Bubble, Cardboard Box: Understanding AI's Real Impact on Your Workforce
We’ve all heard the mantras. "AI won't take your job, but a person using AI will." "AI is just automating the boring parts."
These are comforting platitudes. They’re also likely wrong. We’ve been bracing for AI to disrupt the workforce, but are we looking in the wrong places?
What the Data Shows
Using Horsefly data. A chart plotting AI's potential impact against gender and salary reveals a narrative that’s far more nuanced, and for many, more challenging, than the one we’ve been telling ourselves.
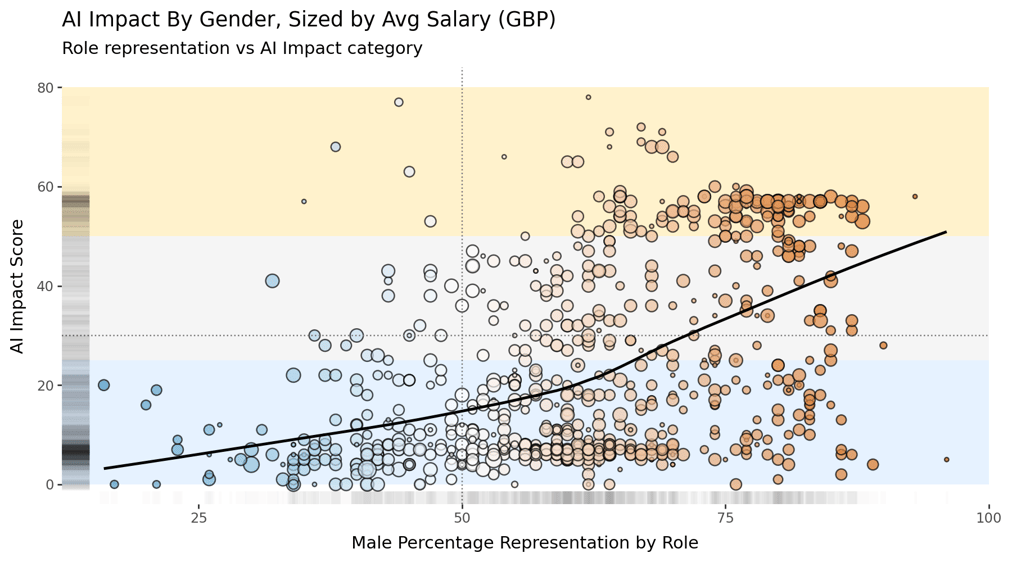
Take a look at this chart. It maps jobs based on three things:
▪️X-axis (Left-to-Right): The percentage of men in the role. (Left = female-dominated, Right = male-dominated).
▪️Y-axis (Bottom-to-Top): The potential "AI Impact Score." (Higher means AI can automate more of the tasks).
▪️Bubble Size: The average salary. (Bigger bubbles = higher pay).
The first thing you’ll notice is the cluster of blue bubbles on the bottom-left. These are female-dominated roles. These are often roles in healthcare, education, and service - jobs high in human interaction and empathy, which AI (for now) struggles to replicate.
But then, look to the top-right. This quadrant is filled with large, orange bubbles. These are high-paying, male-dominated professions. And they are sitting squarely in the high-impact zone.
The data is telling us something profound: the jobs most vulnerable are high-skill, high-paying cognitive jobs. We’re talking
about development, data analysis, operations research, and finance - the very professions that, until recently, looked like
the safest bets in a digital economy.
This Time is Different
Historically, technology automated manual labor, pushing workers into cognitive or service jobs. AI is doing the opposite. It’s coming for the cognitive tasks first.
This creates a feedback loop. The new "AI jobs": prompting, curating, managing models - operate on the AI's home turf of language and data. The very act of doing our job trains the AI to eventually automate it. We are, for now, just generating the training data.
The chart shows us exactly who is generating the most valuable data: the high-paid specialists in the top-right quadrant.
This isn't about AI replacing a factory worker. This is about AI writing code, analyzing complex financial models, and designing systems.
Where Do We Go From Here?
This chart isn't a simple "women are safe, men are at risk" story. Look closer at the bottom-left again. Those "safe" female-dominated roles are also represented by a lot of the small bubbles. They have low AI impact, but they also have low salaries.
Does this mean all the bubbles pop and everyone gets fired? No. But it does mean the definition of their value is changing.
In a job where creating a report, code, or a strategy document costs close to nothing and takes little time, there is less value in making such things.
The "orange bubbles" are likely to see their salaries stagnate or fall. On the other hand, the “blue bubbles” look like the most stable careers on the planet. We may see a societal shift, where "human-centric" work starts to gain the economic respect it has long deserved.
If technical skill is becoming a commodity, how will companies compete? Many are cutting costs by freezing entry-level hiring. It creates an immediate "efficiency spike", making it hard for competitors not to follow suit.
By cutting off the flow of juniors today, the market is engineering a "Missing Middle" crisis. We are heading toward a future
that doesn't just automate jobs, but radically polarizes the workforce: by radically compressing the value of many high-end skills while inflating the value of experience.
Don't Guess, Use A Map
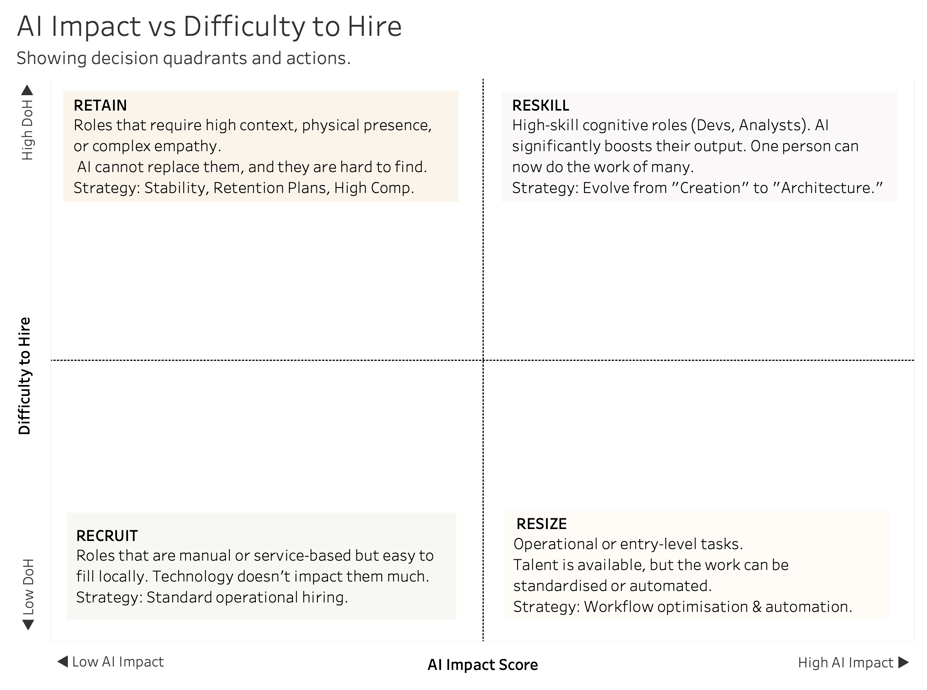
You cannot navigate this shift by guessing. You need a map. The above chart is an outline of how Horsefly uses data to plot AI Impact against the Difficulty to Hire. The result is a decision matrix, categorizing roles into strategic actions.
For example, for the individual in the Low Difficulty of Hire and High AI Impact zone (bottom right). The "person using AI will take your job" phase is in full swing. Productivity is increasing. A single individual developer, analyst, or architect can now do the work of a small team. An action can be taken at low risk.
Note that this is different in the top right: AI may be diagnosed as impactful, but replacing these people will be tough. Re-distributing one’s workforce makes less and more sense depending on the quadrant.
Indeed, that word ‘replacement’ may be a misnomer; the strategy may not be replacement, in fact, that may be one of 6R’s:
retain, reward, reskill, recruit, relocate, resize. AI may be transmogrifying the face of the workforce, but how and whom?
The discussion may lend itself to replacement, but, as the chart shows, a data-driven version introduces the irreplaceable, that rare, AI-impacted, talented individual may just be a keeper. This 6Rs isn't a static map; it is a quarterly health check to ensure your workforce is evolving as fast as the technology.
The question for your talent strategy is simple: when the market looks at your workforce...
Does it swipe right?
Issue January 2026